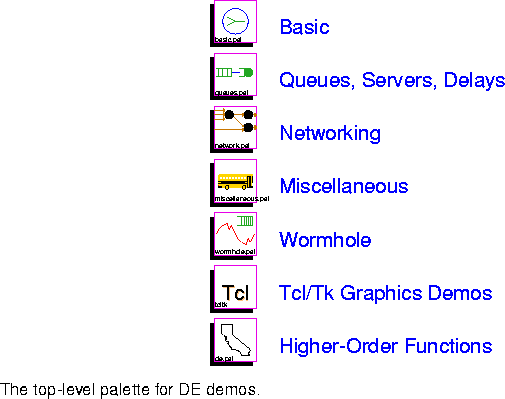


12.4.1 Basic demos
These demos illustrate the use of certain stars without necessarily performing functions that are particularly interesting. The palette is shown in figure 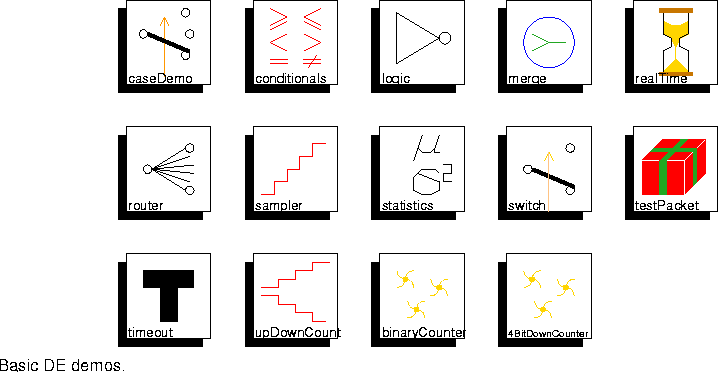
caseDemo Demonstrates the Case star by deconstructing a Poisson counting process into three subprocesses.
conditionals Demonstrate the use of the Test block in its various configurations to compare the values of input events with floating-point values. The input test signal is a pair of ramps, with each event repeated once after some delay. Since the ramps have different steps, they will cross.
logic Demonstrate the use of the Logic star in its various instantiations as AND, NAND, OR, NOR, XOR, XNOR and inverter gates. The three test signals consist of square waves with periods 2, 4, and 6.
merge Demonstrate the Merge star. The star is fed two streams of regular arrivals, one a ramp beginning at 10.0, and one a ramp beginning at 0.0. The two streams are merged into one, in chronological order, with simultaneous events appearing in arbitrary order.
realTime Demonstrate the use of the Synchronize and Timer blocks. Input events from a Clock star are held by the Synchronize star until their time stamp, multiplied by the universe parameter timeScale, is equal to or larger than the elapsed real time since the start of the simulation. The Timer star then measures the actual (real) time at which the Synchronize output is produced. The closer the resulting plot is to a straight line with a slope of one, the more precise the timing of the Synchronize outputs are.
router Randomly route an irregular but monotonic signal (a Poisson counting process) through two channels with random delay, and merge the channel outputs.
sampler Demonstrate the Sampler star. A counting process with regular arrivals at intervals of 5.0 is sampled at regular intervals of 1.0. As expected, this produces 5 samples for each level of the counting process.
statistics Compute the mean and variance of a random process using the Statistics star. The mean and variance are sent to the standard output when the simulation stops. This action is triggered by an event produced by the StopTimer star.
switch Demonstrate the use of the Switch star. A Poisson counting process is sent to one output of the switch for the first 10 time units, and to the other output of the switch for the remaining time.
testPacket Construct packets consisting of five sequential values from a ramp, send these packets to a server with a random service time, and then deconstruct the packets by reading the items in the packet one by one.
timeout Demonstrate the use of the Timeout star. Every time unit, a timer is set. If after another 0.5 time units have elapsed, the timer is not cleared, an output is produced to indicate that the timer has expired. The signal that clears the timer is a Poisson process with a mean inter-arrival time of one time unit.
upDownCount Demonstrate the UDCounter star. Events are generated at two different rates to count up and down. The up rate is faster than the down rate, so the trend is upwards. The value of the count is displayed every time it changes.
binaryCounter Demonstrate the FlipFlopJK star.
4BitDownCounter Demonstrate the use of the other Flip Flop stars.
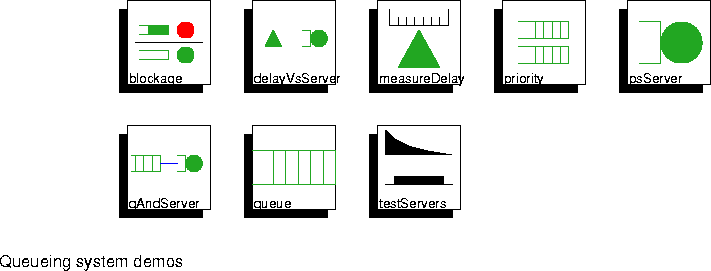
blockage Demonstrate a blocking strategy in a queueing network. In a cascade of two queues and servers, when the second queue fills up, it prevents any further dequeueing of particles from the first queue until it once again has space.
delayVsServer Illustrate the difference between the Delay and Server blocks. The Delay passes the input events to the output with a fixed time offset. The Server accepts inputs only after the previous inputs have been served, and then holds that input for a fixed offset.
measureDelay Demonstrate the use of the MeasureDelay block to measure the sojourn time of particles in a simple queueing system with a single server with a random service time.
priority Demonstrate the use of the PriorityQueue block together with a Server. The upper input to the PriorityQueue has priority over the lower input. Thus, when the queue overflows, data is lost from the lower input.
psServer Demonstrate the processor-sharing server. Unlike other servers, this server accepts new inputs at any time, regardless of how busy it is. Accepting a new input, however, slows down the service to all particles currently being served.
qAndServer Demonstrate the use of the FIFOQueue and Stack stars together with Servers. A regular counting process is enqueued on both stars. The particles are dequeued whenever the server is free. The Stack is set with a larger capacity than the FIFOQueue, so it overflows second. Overflow events are displayed.
queue Demonstrate the use of the FIFOQueue and Stack stars. A Poisson counting process is enqueued on both stars, and is dequeued at a regular rate, every 1.0 time units. The output of the FIFOQueue is always monotonically increasing, because of the FIFO policy, but the output of the Stack need not be. The Stack is set with a smaller capacity than the FIFOQueue, so it overflows first. Overflow events are displayed.
testServers Demonstrate servers with random service times (uniform and exponential).

FlushNet Simulate a queue with "input flushing" during overflow. If the queue reaches capacity, all new arrivals are discarded until all items in the queue have been served.
LBTest Simulate leaky bucket network rate controllers. These controllers moderate the flow of packets to keep them within specified rate and burstiness bounds.
VClock Model a network with four inputs and virtual clock buffer service.
wirelessNetwork Demonstrate shared media communication without graphical connectivity, using EtherSend and EtherRec stars. Two clusters on the left transmit to two clusters on the right over two distinct media, radio and infrared. The communication is implemented using shared data structures between the stars.
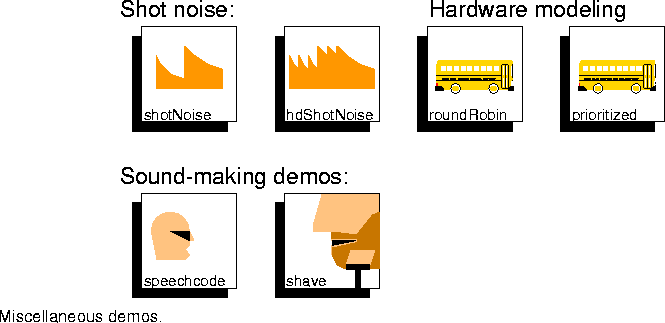
shotNoise Generate a continuous-time shot-noise process and display regularly spaced samples of it. The shot noise is generated by feeding a Poisson process into a Filter star.
hdShotNoise Generate a high-density shot noise process and verify its approximately Gaussian distribution by displaying a histogram.
roundRobin Simulate shared memory with round-robin arbitration at a high level.
prioritized Simulate a shared memory with prioritized arbitration at a high level.
speechcode Perform speech compression with a combination of silence detection, adaptive quantization, and adaptive estimation. After speech samples are read from a file, they are encoded, packetized, depacketized, decoded, and played on the workstation speaker.
shave Demonstrate the Synchronize star to generate a beeping sound with a real-time rhythm.
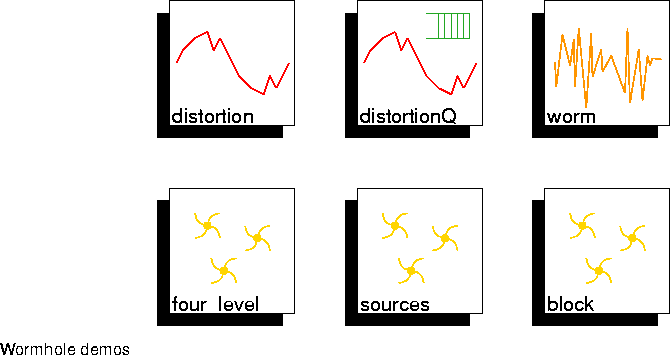
distortion Show the effects on real-time signals of a highly simplified packet-switched network. Packets can arrive out of order, and they can also arrive too late to be useful. In this simplified system, a sinusoid is generated in the SDF domain, launched into a communication network implemented in the DE domain, and compared to the output of the communication network. Plots are given in the time and frequency domains of the sinusoid before and after the network.
distortionQ Similar to the distortion demo. The only difference is in the reorderQ wormhole, which introduces queueing.
worm Show how easy it is to use SDF stars to perform computation on DE particles. A Poisson process where particles have value 0.0 is sent into an SDF wormhole, where Gaussian noise is added to the samples.
four_level A four level SDF/DE/SDF/DE system.
sources Show how to use an SDF star as a source by using a dummy input into the SDF system. The SDF subsystem fires instantaneously from the perspective of DE. The schedulePeriod SDF target parameter has no effect.
block The schedulePeriod parameter of the SDF target determines how the inside of the DE system interprets the timing of events arriving from SDF. When several samples are produced in one iteration, as here, the time stamps of the corresponding events are uniformly distributed over the schedule period.
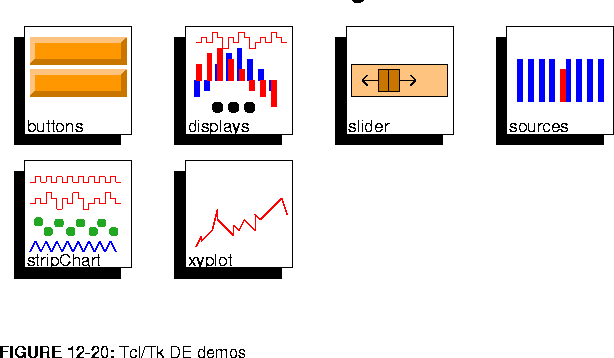
buttons Demonstrate TkButtons by having the buttons generate events asynchronously with the simulation.
displays Demonstrate some of the interactive displays in the DE domain.
slider Demonstrate TkSlider by having the slider produce events asynchronously. The asynchronous events are plotted together with a clock, which produces periodic outputs in simulated time. Notice that the behavior is roughly the same regardless of the interval of the clock.
sources A Tcl script writes asynchronously to its output roughly periodically in real time (using the Tk "after" command). The asynchronous events are plotted together with a clock, which produces periodic outputs in simulated time. Notice that the plot looks roughly the same regardless of the interval of the clock.
stripChart Demonstrate the TkStripChart by plotting several different sources.
xyplot Display queue size as a function of time with an exponential random server.TkPlot star overlays the plots as time progresses, which the TkXYPlot star does not. Thus, the points on the TkXYPlot star go off the screen to the right. The TkStripChart star records the entire history.


